Thermography
See heat problems from the ground or from the air. Thermal cameras show temperature differences across modules, junction boxes, connectors, combiner boxes and inverters. Drone-mounted cameras sweep a large plant quickly, while hand-held cameras confirm details at close range.
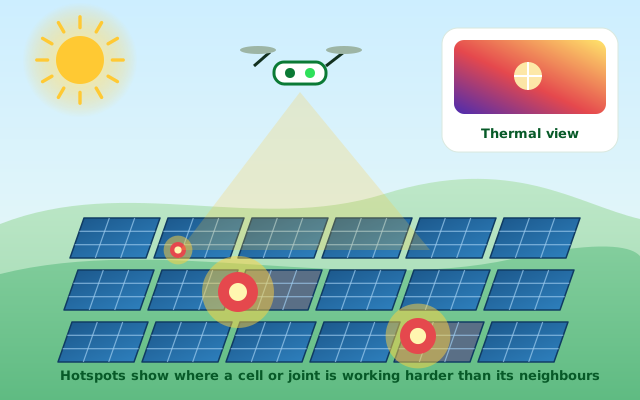
- You suspect hotspots, burnt cells or bypass diode faults
- Connectors or cables feel hot or show discolouration
- A large plant needs a quick whole-site health screen
- Before and after repairs to confirm improvement
- Covers a whole plant in far less time than walking every row
- Catches safety risks such as hot connectors early
- Shows where to spend repair budget first
How we do it, step by step.
Fly or scan in good irradiance, because thermal faults show up best under strong sun and load.
Cover all rows with a drone or camera and tag every anomaly with its location.
Check the worst findings at close range and measure with IV tracing where useful.
Sort anomalies by the temperature rise and by the safety and energy risk they carry.
- A tagged map of anomalies by block, row and module
- A shortlist of modules and joints to repair or replace
- A baseline image set to compare against next year
Outcomes depend on what the inspection finds. Possibilities are labelled as such in every report.
- Thermal and visual image pairs for each anomaly
- Site map with anomaly locations
- Risk-ranked repair list
Instruments: Radiometric thermal camera, drone with thermal payload
Broken modules still connected to strings at a Rajasthan plant
The article does not report what was repaired afterwards.
Read the case →Other services
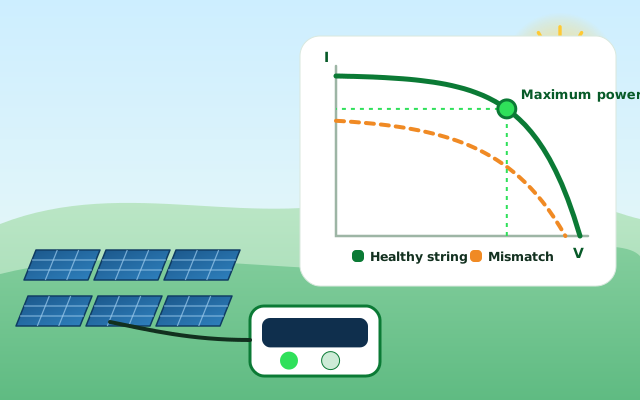
IV curve tracing
Measure what each string and module can really deliver.
See the process and outcomes →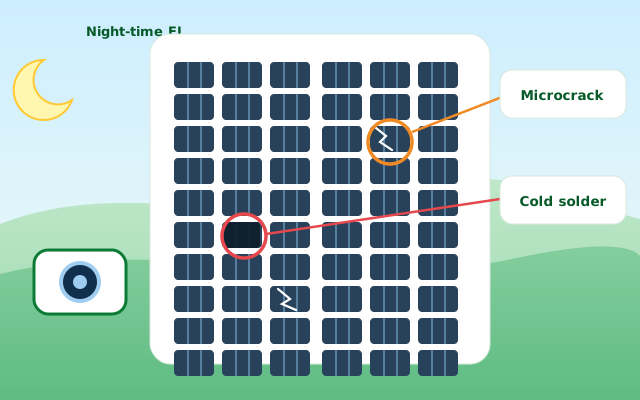
Electroluminescence (EL) imaging
Look inside cells for cracks and bad solder joints.
See the process and outcomes →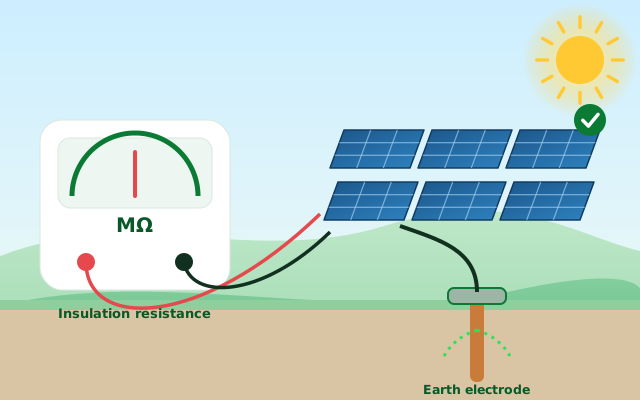
Insulation and earthing tests
Check the plant is safe, and leaking no energy to ground.
See the process and outcomes →Want this test on your plant?
Send an enquiry and we will prepare a checklist for your site.